
Reader Contribution: So you think the Tories are economically competent? Think again ...
From Thatcher to Sunak: how the data compares to the reputation.

Long-time reader Andy Burge has spent a considerable amount of time pulling together official statistics to examine the economic record of UK governments since 1979.
Rather than arguing from slogans, he argues from tables. What follows is his attempt to test the claim of “economic competence” against inflation figures, debt ratios, wages and employment data - and to see what survives that scrutiny.
You can find more from Andy at his own Substack below:

Introduction

The Conservative party of His Majesty’s (dis)United Kingdom of Great Britain and Northern Ireland markets itself to the electorate of this realm as the party of low tax, low inflation, fiscal responsibility, high employment and economic competence. Like much marketing, this is spin and in this column I show you the evidence for this. In short, here is the case of the UK Electorate vs the Tories.
I have compared the economic records of each individual Prime Ministerial administration between 1979 and the end of January 2026. I have summarised the three long periods of government:
The 18 year Thatcher/Major period of 1979-1987
The 13 year Blair/Brown period of 1997-2010
The 14 year Cameron//May/Johnson/Truss/Sunak period of 2010-2024
For each administration, I have collated 7 tables that show conclusively that the Tories lie to the UK electorate about their economic record. All statistics are sourced. So without further ado and if your Lordships please …
Inflation
Source1. Let’s start with the most basic of figures; inflation. I have used the Consumer Price Index (CPI) figures where possible. For early statistics where CPI stats were not available, I have used Retail Price Index figures. I have ensured I compare like with like. So how do the Tories stack up against Labour on this most basic of economic competencies? Table 1 shows you how
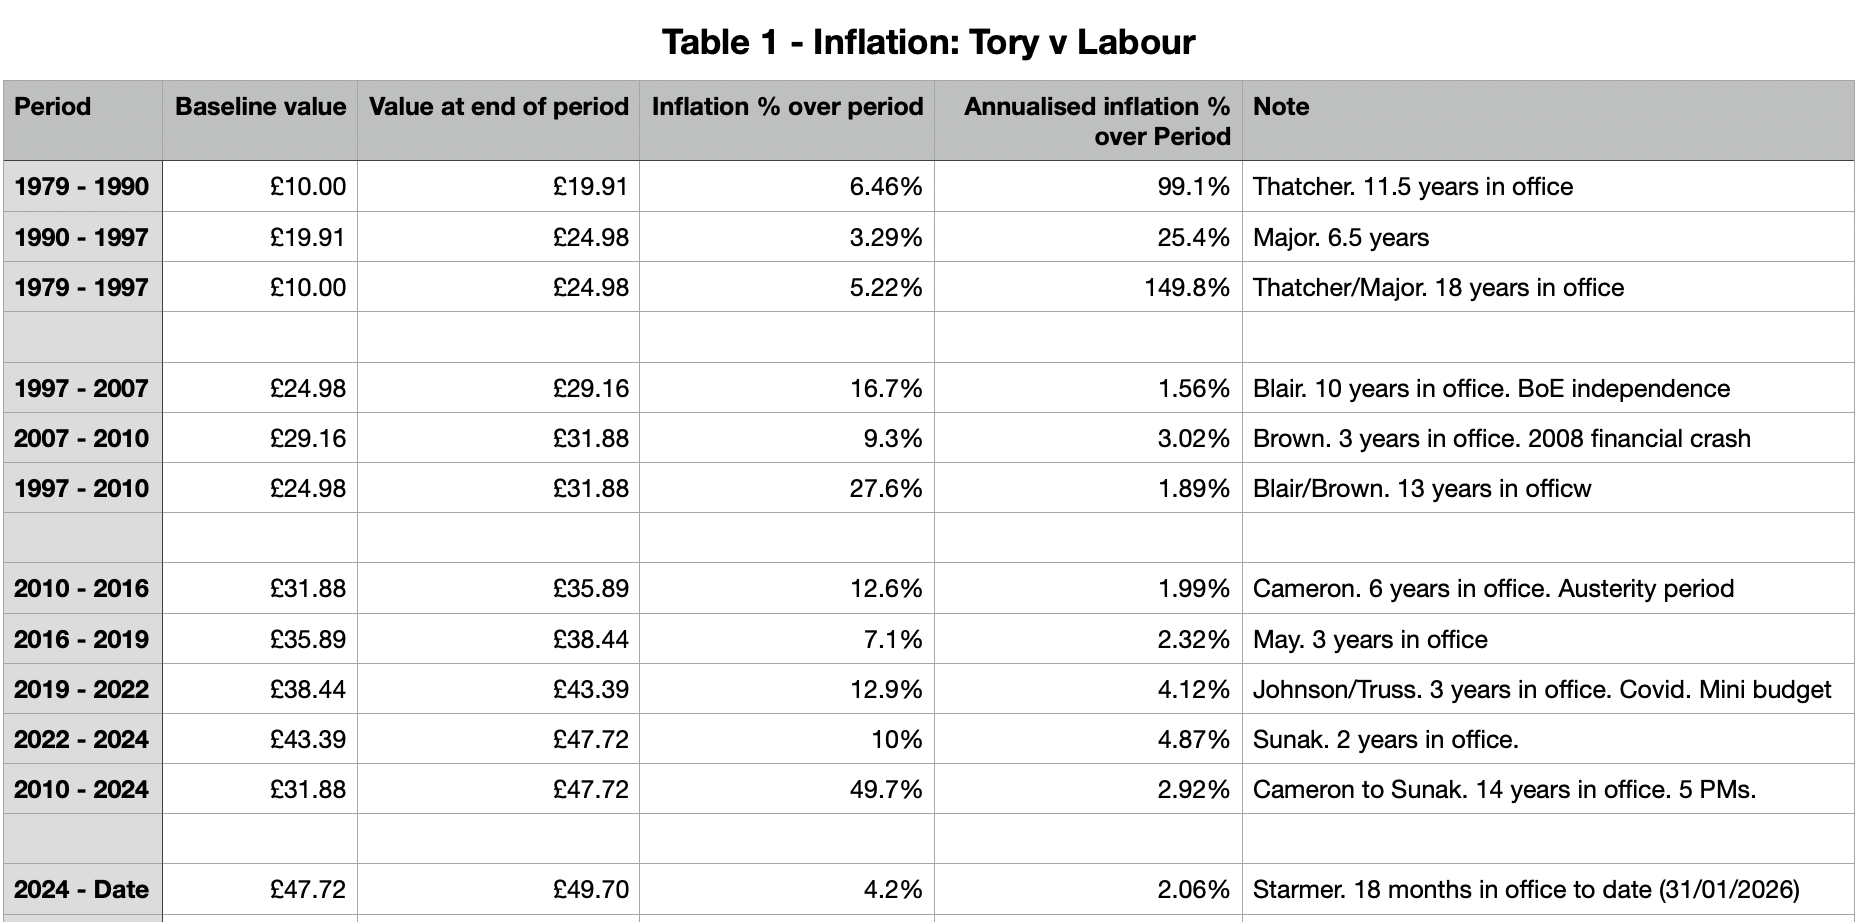
During Margaret Thatcher’s and John Major’s 18 years in power, inflation rose year on year by 5.22%. Doesn’t sound too bad does it? Total inflation over the 18 year period was 149.8% which sounds bad but 18 years is a long time right? Actually it’s a dreadful record. Compare it to the 13 years of Labour government under Blair and Brown; they managed a year on year inflation rate of just 1.89% or 27.6% over their 13 years in office. The 14 years of various Tory administrations of Cameron, May, Johnson, Truss (the less said about her the better) and Sunak (as the Tories sought a new Prime Minister every week or so it seemed) allowed year on year inflation to rise to nearly 3% totalling almost 50% over the period. One might ask why the austerity period was one of relatively low inflation. The answer is that nobody was spending any money so manufacturers had to absorb rising costs in supply chains and wholesalers and retailers had to reduce their prices.
National Debt and Deficit
Sources2. The Tories like to bang on relentlessly about the UK national debt deficit and debt as if it’s some sort of patriotic failure that we are indebted. In fact, deficits are bad but debt is inevitable. Every large developed and developing economy is indebted. First some definitions:
Debt is the total debt owed by a country.
Deficit (or PSBR) is the shortfall between the government’s tax receipts and its spending for a given period.
Debt or Deficit expressed as a percentage of Gross Domestic Product known as GDP (the money generated by a country) for a given period is often used in comparing different countries’ economic performances. Here are the G7 debt/GDP percentages for 2025.
Here are the national debts of the G7 expressed as a percentage of their GDPs to 2025:
Japan - 234.9%
Italy - 137.3%
US - 122.5% (the US national debt is projected to be $43.34 trillion by the time Trump leaves office in 2028, always assuming he actually does leave office which is by no means a certainty)
France - 116.3%
Canada - 112.5%
UK - 95.5%
Germany - 65.4%
As you can see, we have the 6th lowest debt/GDP percentage of the G7.
When Harold MacMillan was asked what was most likely to knock a government off course he is alleged to have replied “events dear boy, events”. Though most likely apocryphal (he wasn’t that sharp), this maxim has proved to be correct in that administrations of both colours have had some very bad luck.
The Brown administration was faced with the global financial crisis that hit in 2008 and was caused by the creation of sub-prime property collateralised debt obligation (CDO) products (aka high risk mortgages) which the banks sold to each other, often repeatedly. This was no more than reckless, out of control gambling by the world’s financial institutions. The crisis was NOT caused by Brown’s government and any Tory repeating that line is lying, and they know they’re lying.
The Tory administration under Johnson was hit by the Covid-19 pandemic. In both cases money had to be borrowed to keep the economy working in some semblance of normality otherwise millions of people would have lost their jobs and homes and we would have been hit by a depression that would have made the crash of 1929 seem like an economic boom.
That said, it is valid to argue that in both cases, the governments concerned did not anticipate or plan for the events that came about even though they were in receipt of solid evidence that they would at some point occur. In the case of Brown’s government, it applied only “light-touch” regulation to the City whereas he should have read a little more economic history, particularly about the US economy between 1896 when McKinley was elected, to 1936 when Roosevelt enacted the first and second of his “New Deals”. Had Brown tightened up financial regulation in the City, though this would have only been effective in the UK, the crisis may have been a little less detrimental. In Johnson’s case, the Covid inquiry has shown that he and his government reacted indecisively and responded incompetently and too slowly to the crisis thus making an already bad situation far worse than it should have been.
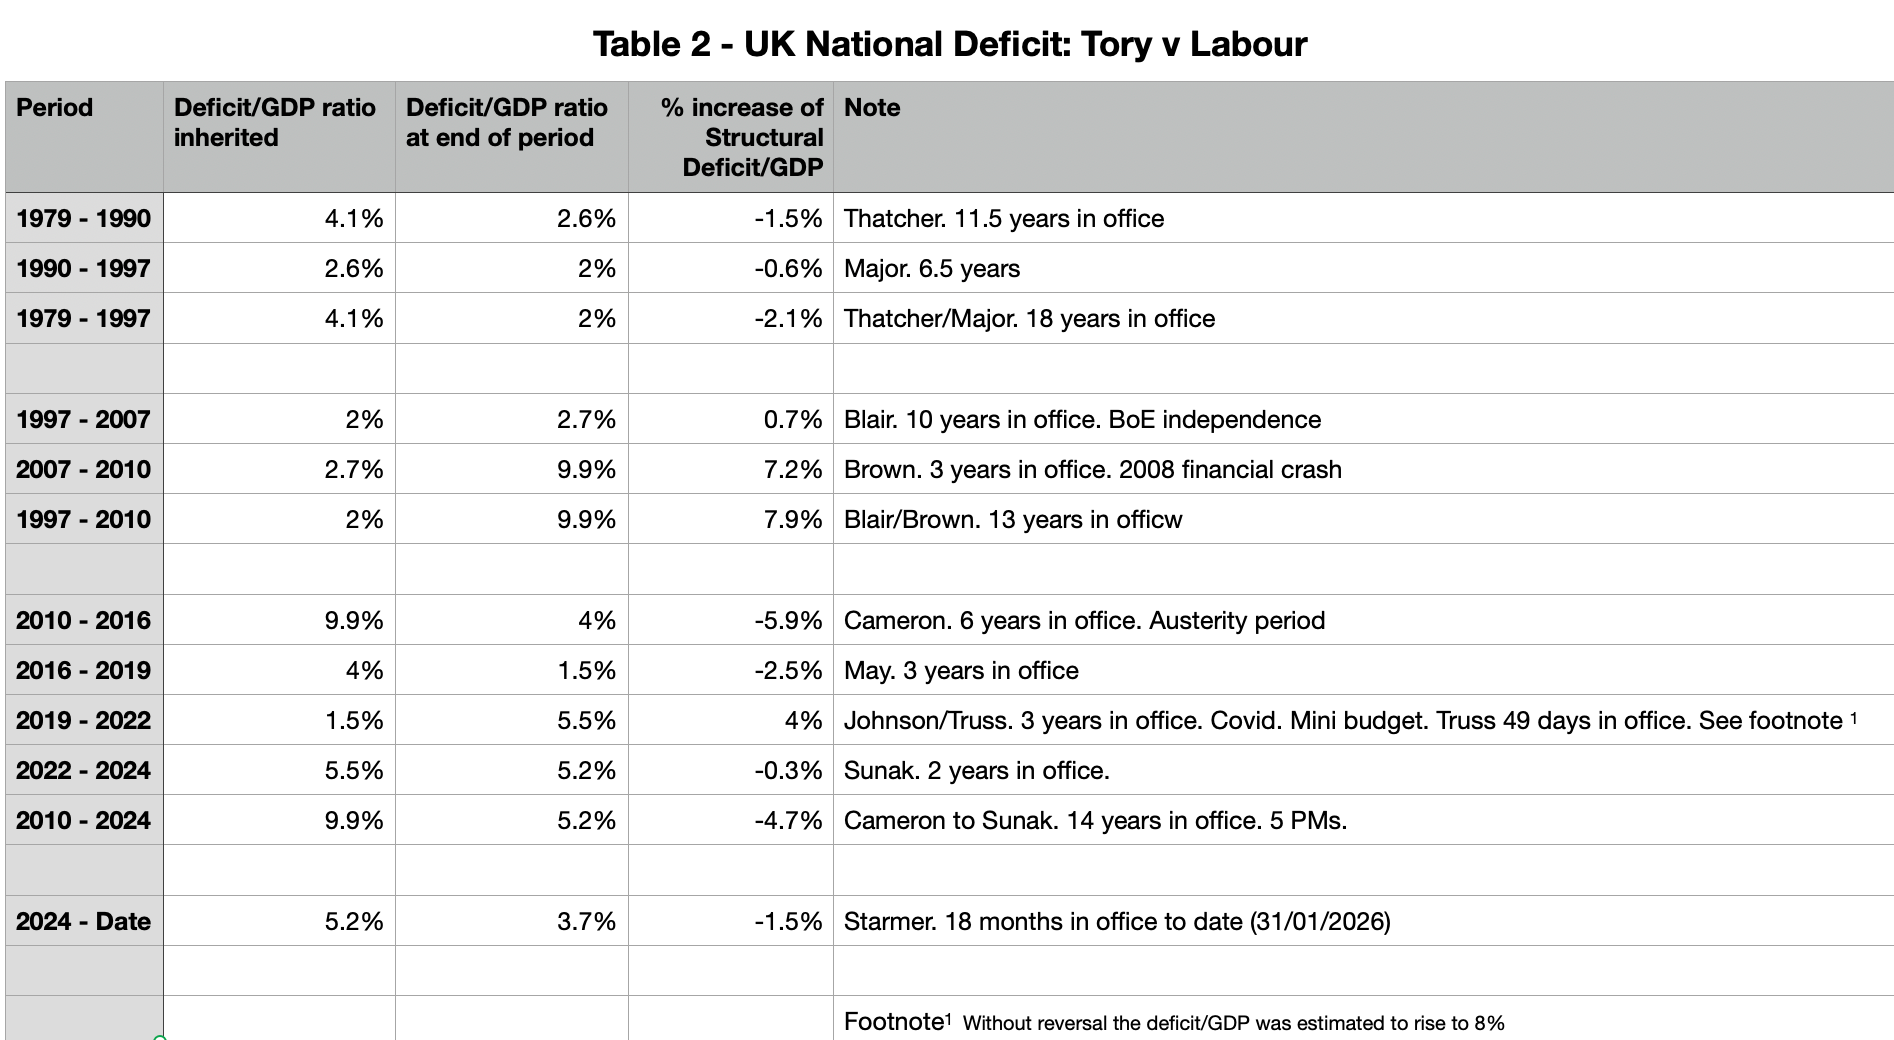
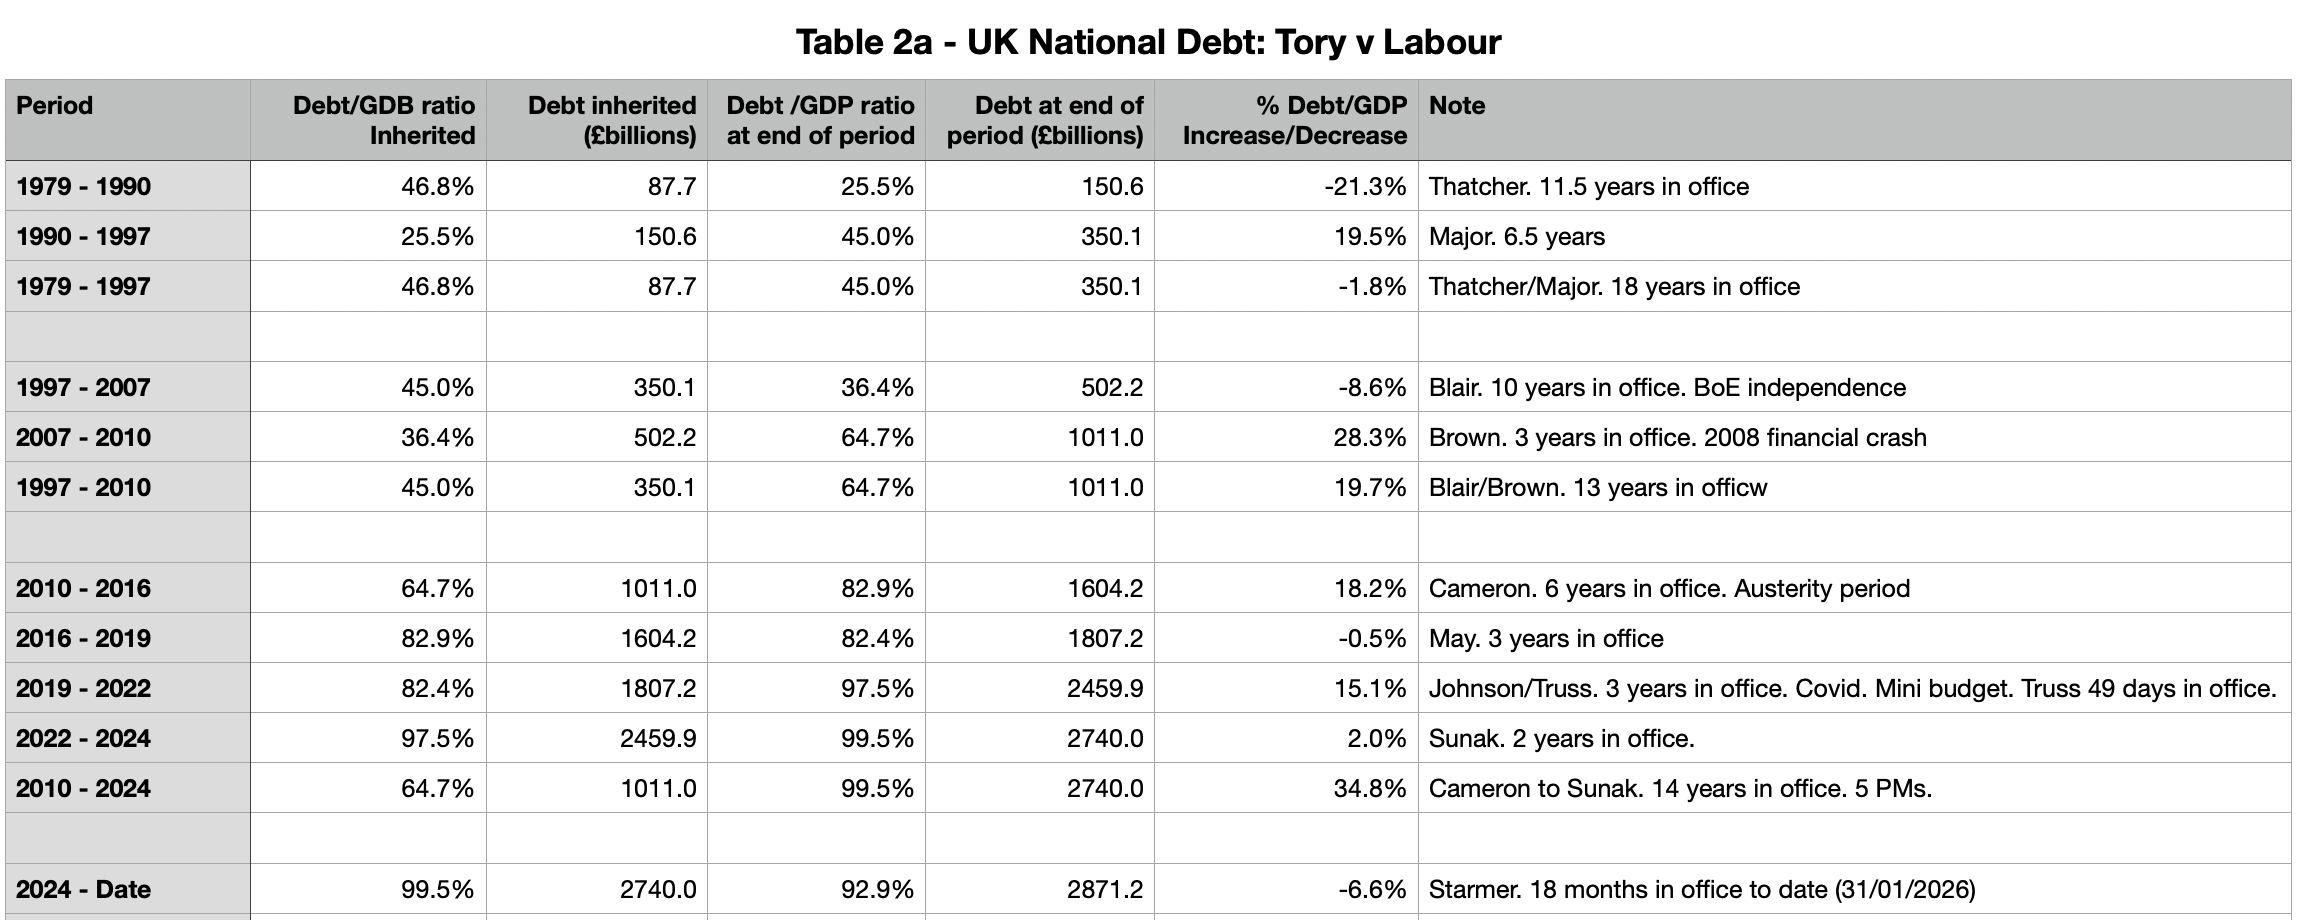
Tables 2 and 2a show that Thatcher/Major were successful in bringing down the deficit. How? Firstly they privatised everything they could which brought £billions to the Treasury. Secondly they cut public services. Thirdly they used the windfall of North Sea oil revenues to hide the failings and consequences of their economic mis-management such as unemployment. Debt however still increased.
Under Blair and Brown, the debt and deficit increased because they restored public services and had to deal with the global financial crash. Under the various Tory administrations that followed both debt and deficit increased even more than under Blair and Brown. Yes they had to deal with Covid but their austerity suppressed salaries which meant that people were not spending much, if any, money and consumer spending is a very significant factor in generating economic growth. Both the right wing IEA and Adam Smith Institute and the left wing NEF and Common Wealth agree on that point at least. With regard to policies to deal with a structural deficit, the left and right disagree almost entirely.
Incidentally, the joke letter left by Liam Byrne, chief secretary to the Treasury under Gordon Brown, proved to be a gift for the Tories. Because Labour did not respond to the Tory jibes, The letter allowed Cameron and Osborne to con the British people into believing that:
The public sector finances were left in a mess by Labour
Tough though it might be, austerity was the only solution to Labour’s mess
They, the public, had to pay for Labour’s mess
This was yet another calamitous error by Labour’s inept comms team and it paved the way for the Tories to do what they had always wanted to do; to destroy or privatise public services. I was one of those conned in those days and was persuaded to do some research by my very bright first cousin’s 17 year old daughter who sent me some links. They opened my eyes and I delivered the required mea culpa. In fact, as we all now know, the real perpetrators of the economic crisis were the largely unregulated big banks and financial institutions in the City and in the US that went on a reckless gambling spree. The public finances and indeed public services were still in good shape thanks mainly to the actions taken by Brown and his Chancellor Alistair Darling to deal with the crash. They not only left the economy in as good a shape as was possible but also allowed millions of us to keep our homes and jobs. The alternative does not bear thinking about, and this is no exaggeration; millions of people in the UK, women and children included, would have been destitute with no home, no job, no money and no food. Millions would have been begging, living, starving and dying in the streets. As I intimated earlier, the crash of 1929 and the subsequent depression would have been a gentle almost trivial walk in the park by comparison.
Unemployment
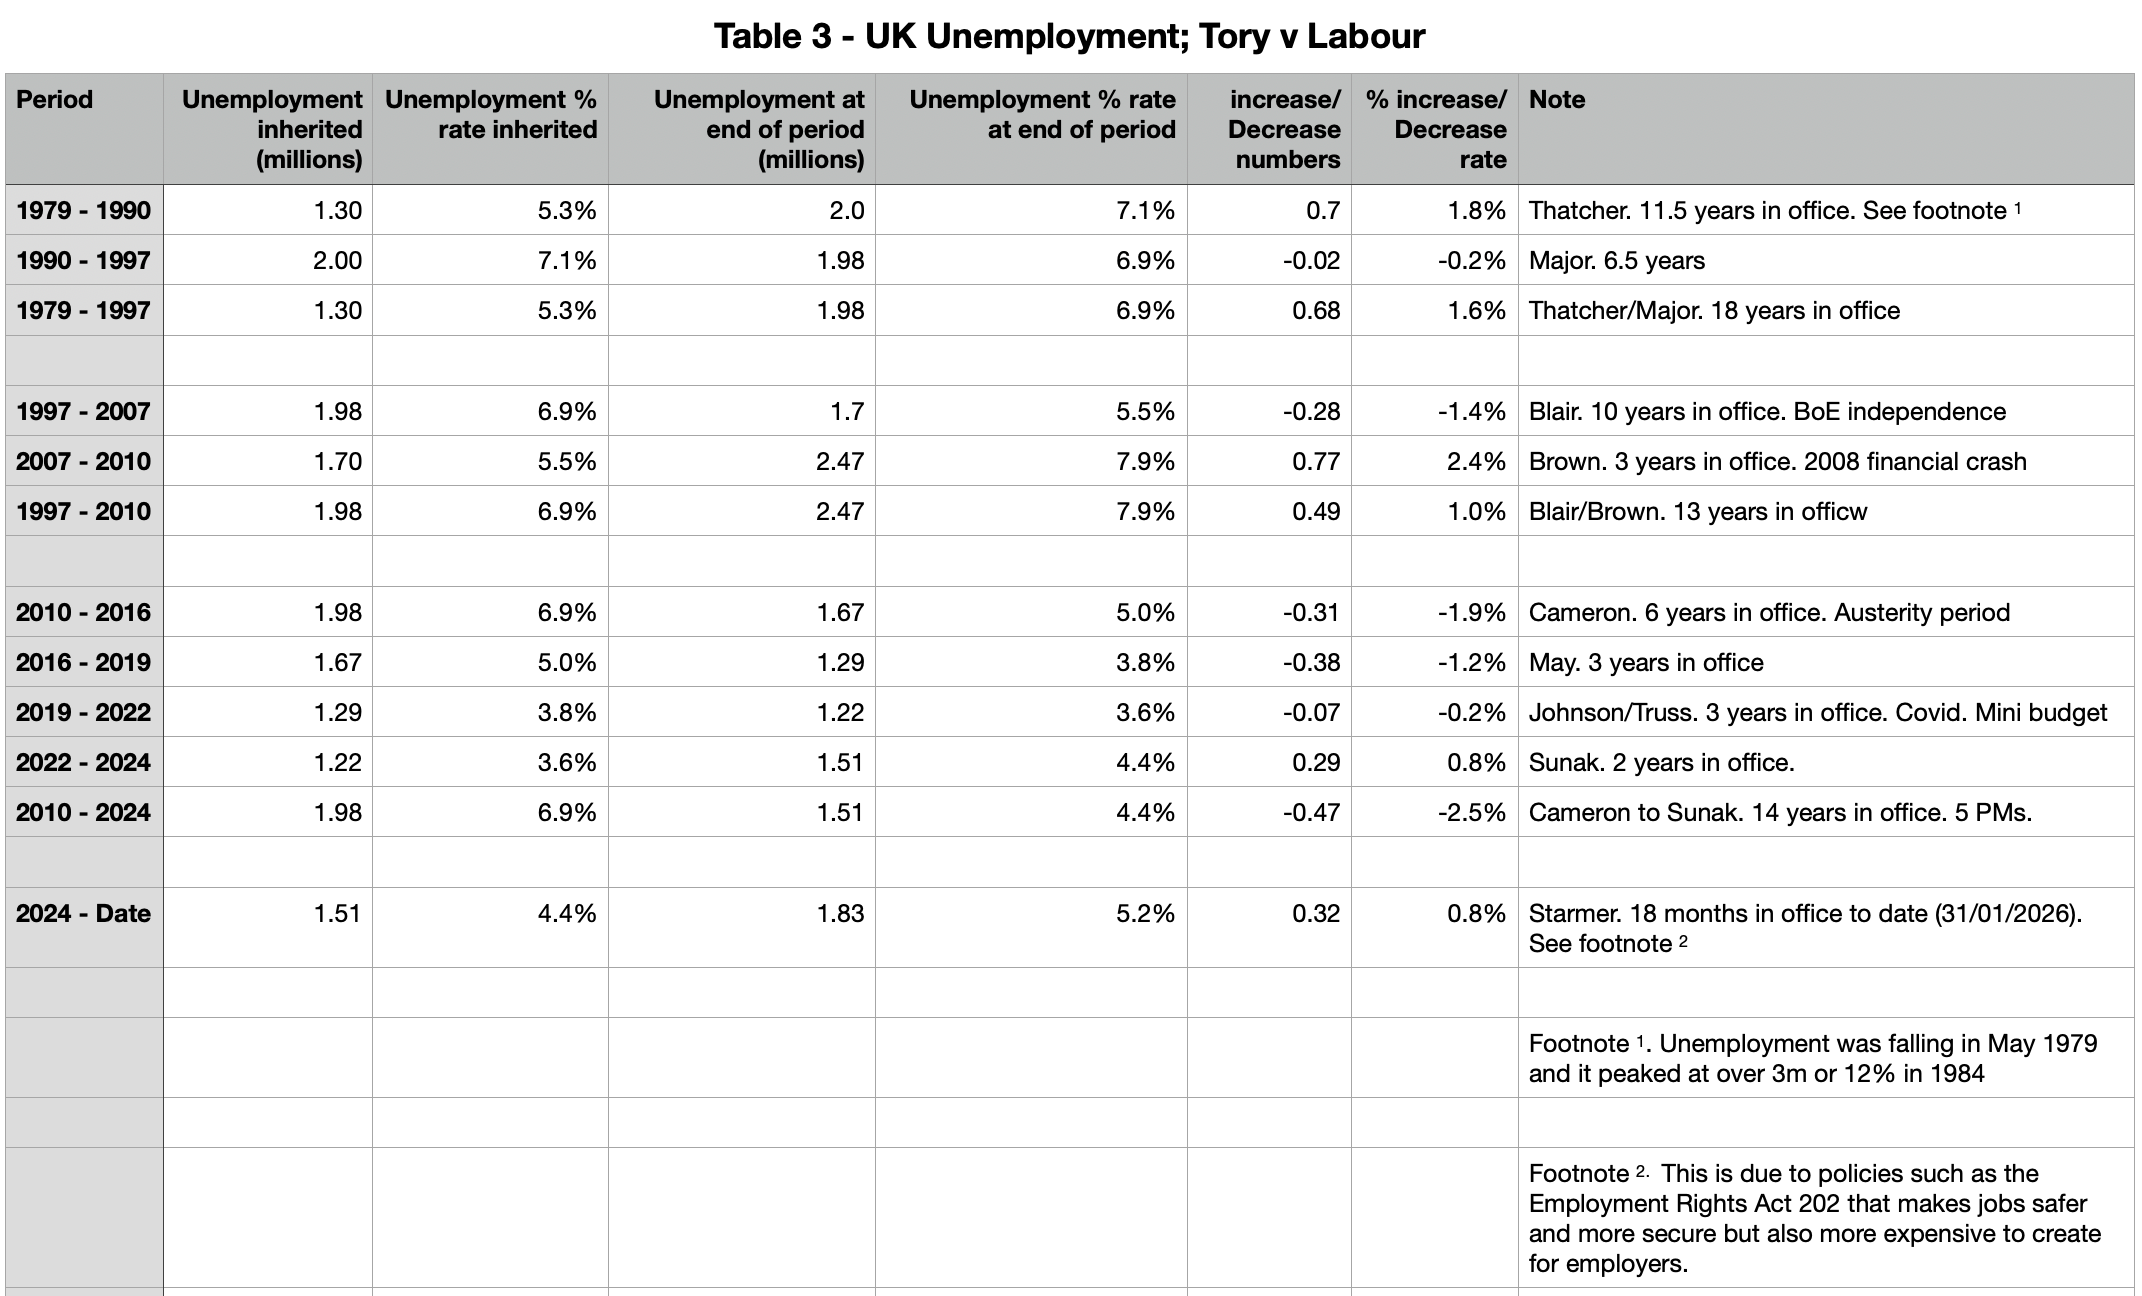
Sources3. The Tories are very fond of saying that every Labour government has left office leaving unemployment higher than when they came into power. Indeed Andrew Griffith MP only recently repeated this in parliament on 28/01/2026 when he was deputising for his leader at Prime Minister’s Questions. The Tories repeat this lie ad infinitum and at every opportunity. Well I’ve not researched every labour government since 1945 but sticking with the periods of time we are examining, lets’s see if this is true:
In fact, the claim is largely true but it does depend on how one defines “government” and “unemployment”. I go into this in greater detail in my column entitled “Does Labour Always Leave Office with Unemployment Higher than when It Came to Power as the Tories Claim?” and that shows why the relatively small increases in unemployment, even after the financial crash, were caused by Labour policies that helped millions of people. Yes, I’m aware that this appears to be cognitively dissonant.
Thatcher and Major left an unemployment rate of 7.9%. Blair reduced this rate significantly and Brown, even after being hit by the 2008 financial crisis, managed to keep the unemployment rate increase to just 1%. Cameron decreased unemployment but this was not a difficult task given that Brown had managed the 2008 financial crash so well and Cameron kept his measures such as quantitative easing in place. This did not stop Cameron and Osborne from launching austerity though. One would instinctively think that austerity would increase unemployment. While this was true of the Public Sector over which Cameron and Osborne had complete budgetary control, the effect in the Private Sector was very different. Private Sector employers used austerity to reduce and suppress wages and contractual working conditions in their favour and this was made possible by Tory legislation that further reduced worker’s rights and safety regulations. Thus, employing people was much cheaper and less risky from the perspective of an employer.
May reduced unemployment by means of increasing labour market flexibility. She maintained a flexible hiring/firing environment heavily weighted in employers’ favour which made employing people even cheaper and less risky. May pushed ahead with welfare reforms which regardless of an unemployed person’s medical status, qualifications, experience or ability, linked benefits to participation in employment initiatives.
Under the Johnson/Truss administrations (though I include her only for the purpose of a clear end date), unemployment remained almost the same as it was when Johnson took office.
To summarise, the various Tory administrations did bring down unemployment but they did this by means of making jobs less secure, removing workers’ rights and suppressing wages thus making it far easier to exploit them.
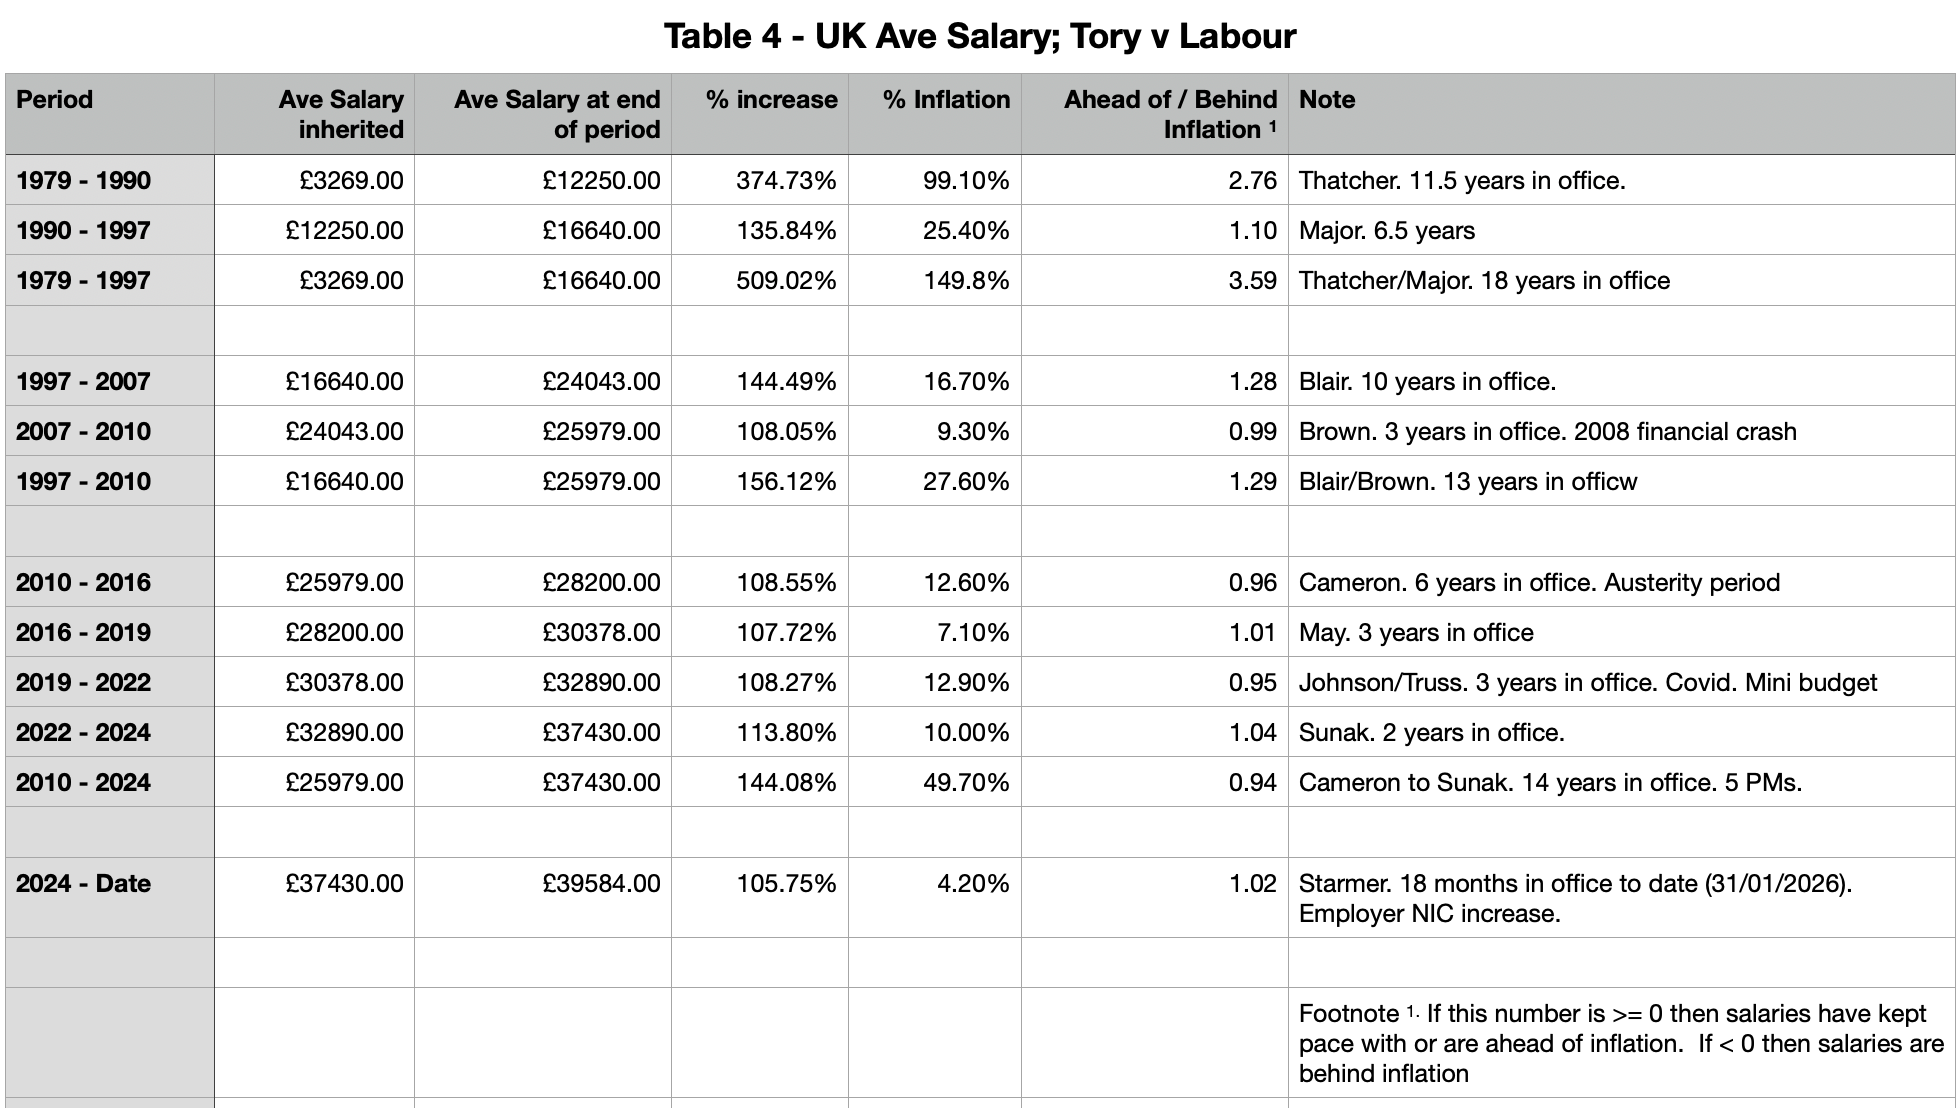
Average Salary
Sources4. Table 4 is fairly self explanatory. Any number less than 1 in the column headed ‘Ahead of/Behind Inflation’ means that wages fell in real terms. The table shows clearly that under the various Tory administrations between 2010 and 2024 (and especially under austerity in which the British people were forced to pay the gambling debts of Cameron’s and Osborne’s Tory donating city mates) wages were ruthlessly suppressed (this is why NHS resident doctors are saying enough is enough and are striking - their pay is still 7% lower in real terms than it was 16 years ago in 2010). It’s unfortunate that Labour is copping the worst of the NHS doctors’ anger when this was the Tories’ doing but hey ho).
This is also how the Tory governments between 2010 and 2024 were able to reduce unemployment; reduce wages (oh and remove workers’ rights too) and you make it more attractive for unscrupulous employers to employ people but those jobs offered wages on which many could not live hence more and more people were forced to claim in-work benefits through the Universal Credit system.
Under all other administrations Wages kept well ahead of inflation.
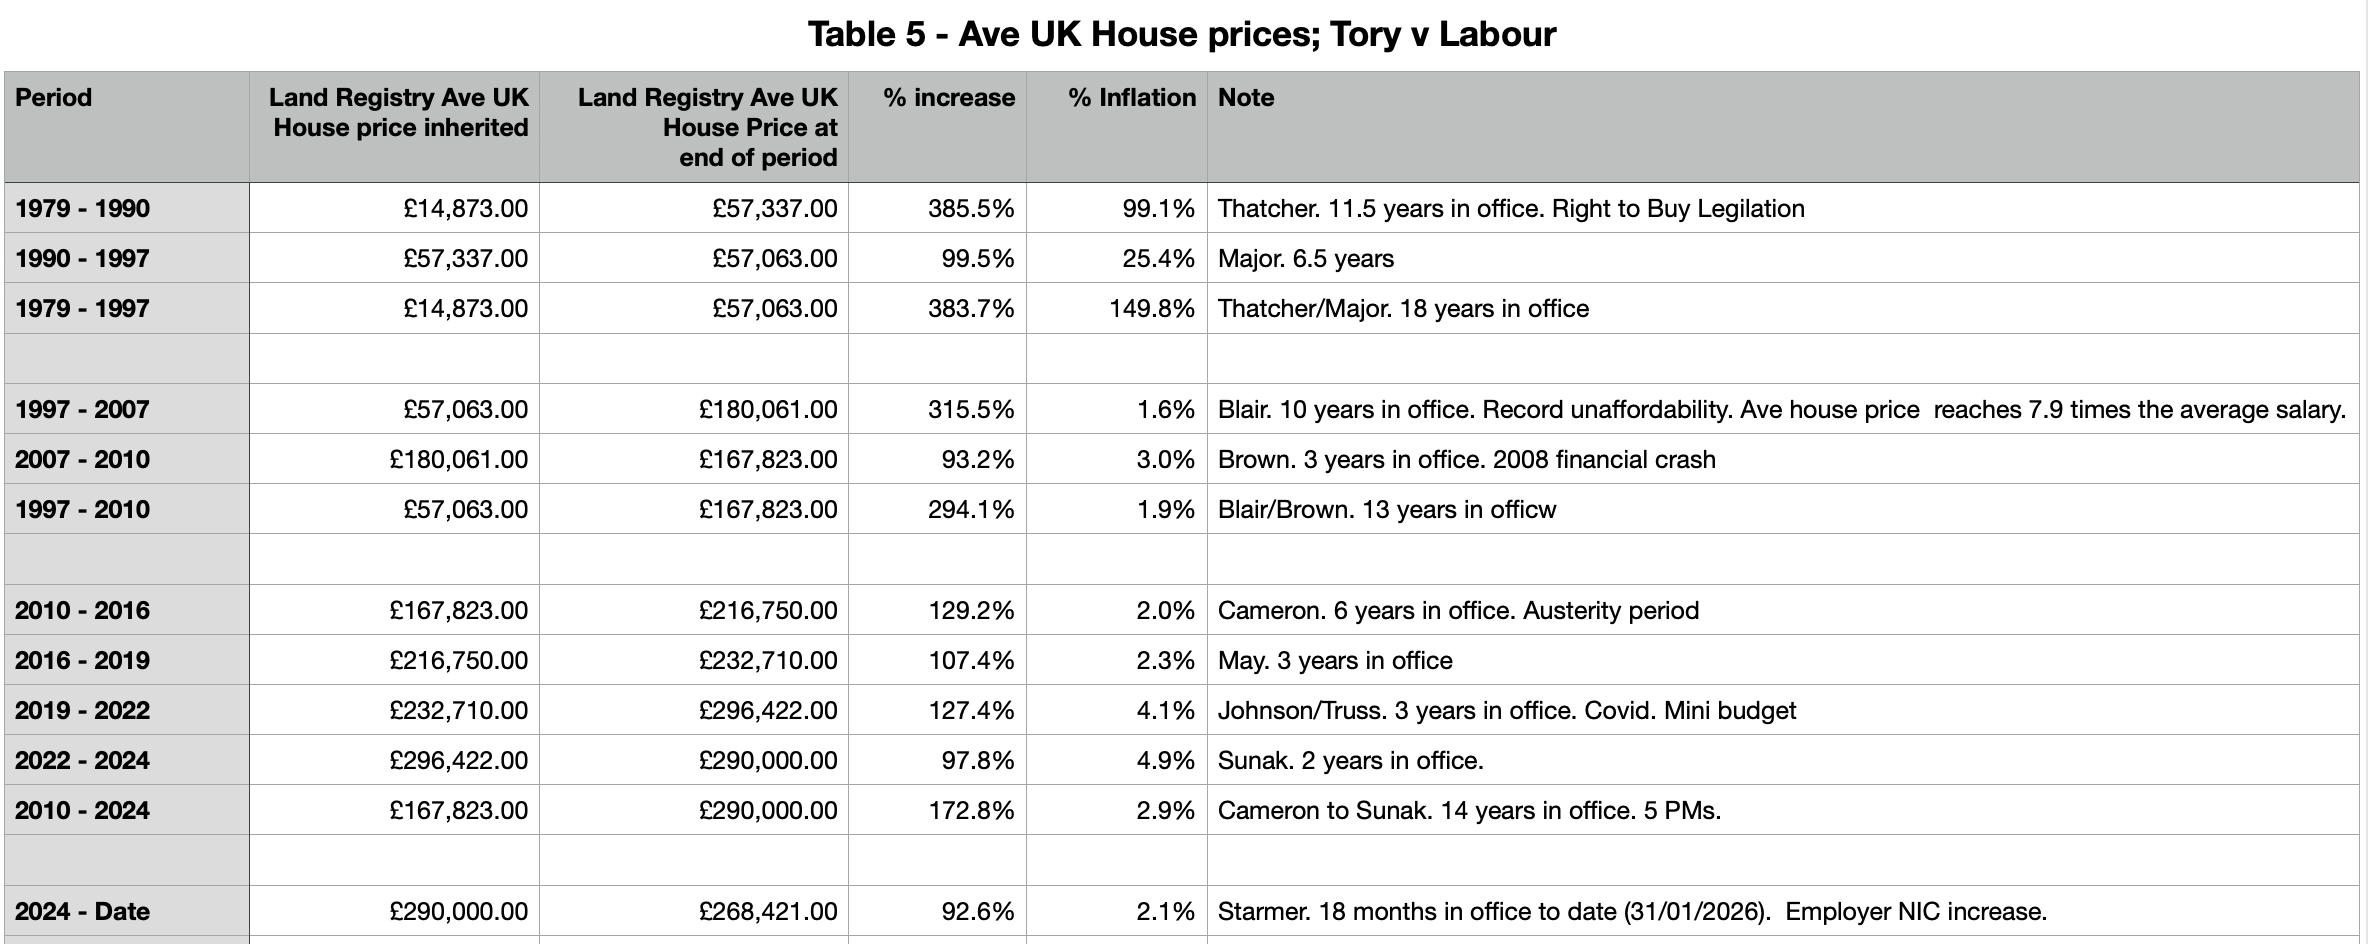
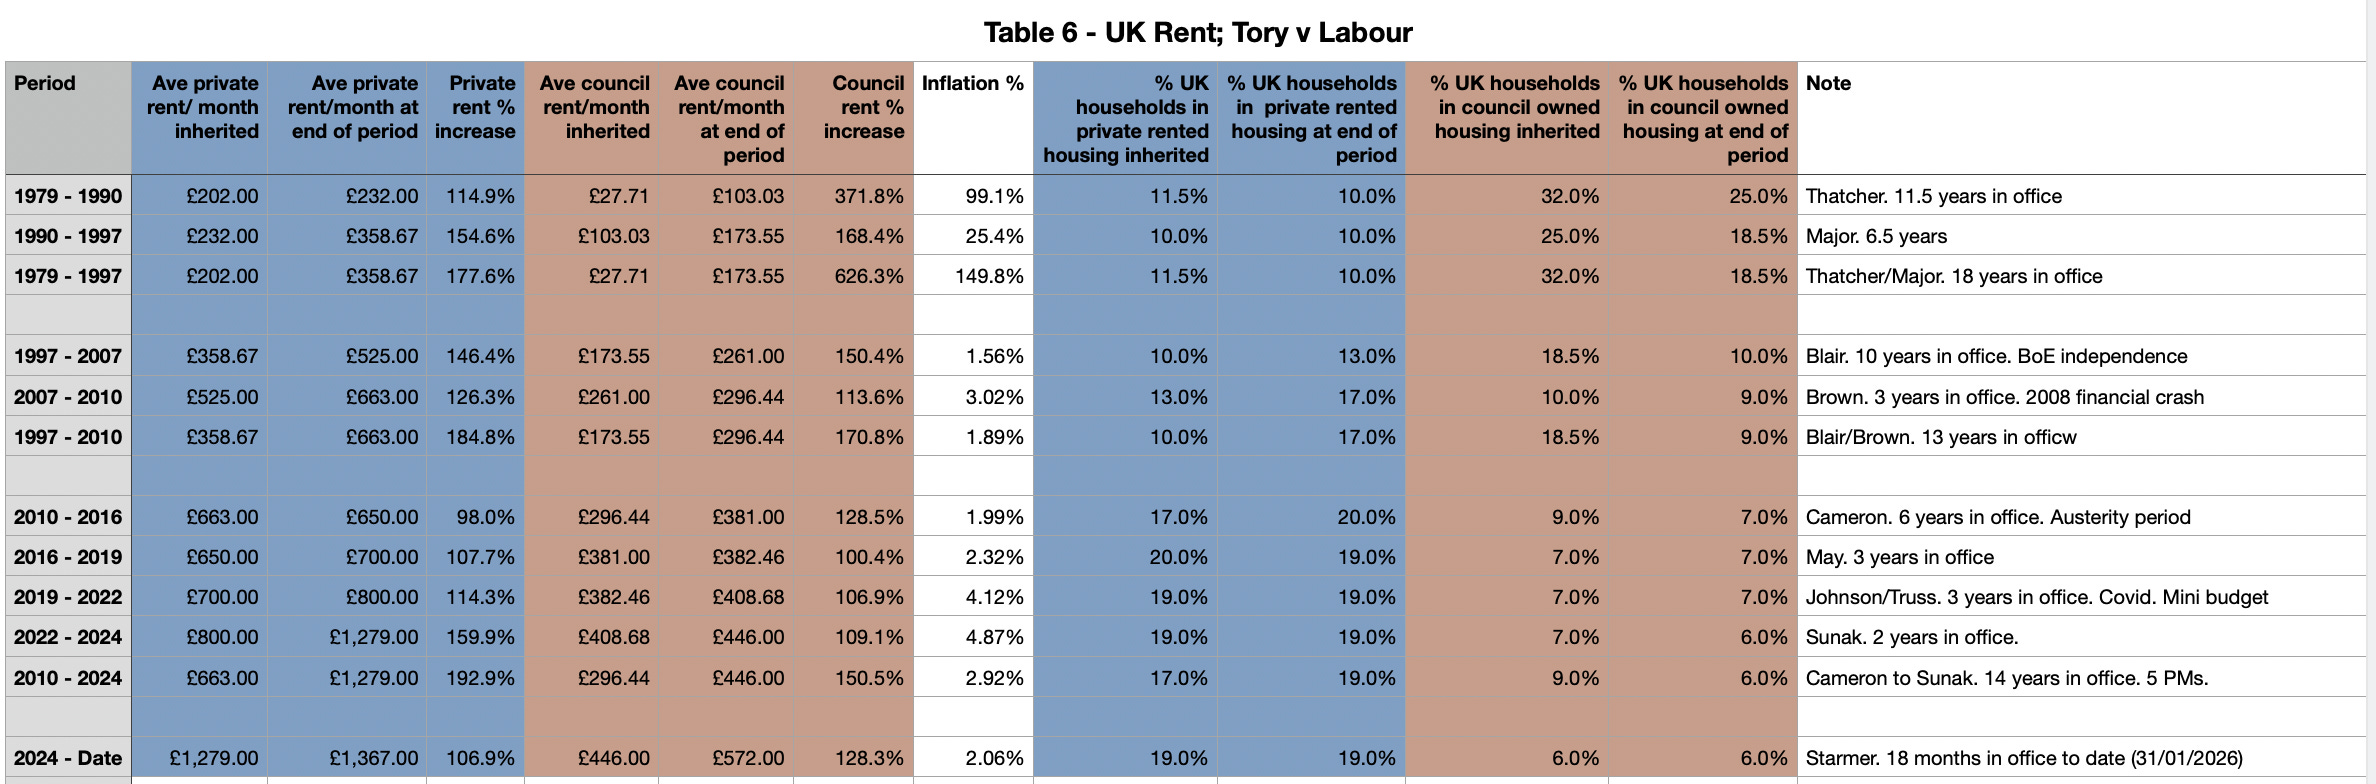
Average House Price and Accommodation Rental Cost
Sources5. We all know now that Thatcher’s “right to buy” policy (which is still in force would you believe) along with its ridiculously large discounts on offer to tenants and its harsh restrictions on replacing council houses sold has been by far the single biggest cause of the housing crisis in the UK that began after Thatcher’s legislation was enacted in October 1980. Thatcher regarded her legislation as the foundation stone on which she would build to create a “property-owning democracy”. She saw it as a means to empower individuals (there’s that word again) by shifting them from “state dependency” to individual ownership and responsibility.
In this she was successful6 (though the policy’s pernicious effect took 18 years to fully materialise and Blair and Brown have a lot to answer for in not repealing/amending her legislation when they came to power) because the discounts offered versus market prices7 were phenomenal but this came at a terrible cost in living conditions and quality of life for the poorer and more vulnerable in UK society. House prices have spiralled making owning a property far more difficult8. The reduction in council housing has led to a large increase in people having to rent privately. What has happened to what were once council houses as a result of Thatcher’s policy? A large number originally sold to tenants have been sold on and on and on again until the majority of them are now in the hands of property tycoons and property management companies.
I have not bothered to do any research into statistics regarding the property development propaganda slogan “Affordable Housing”. What “Affordable” really means is that the asking price is a bit cheaper and if you qualify you get fewer amenities and we make damned sure that those who paid full whack know who you are to ensure your maximum shame. Anyway, most of you plebs still won’t be able to afford even the marginally reduced price.
Here are the numbers for you. The full horror becomes clear when one compares, for a given period:
the percentage increases in rents with the inflation rate
the rapid increase in privately rented households
the rapid decrease in council rented households
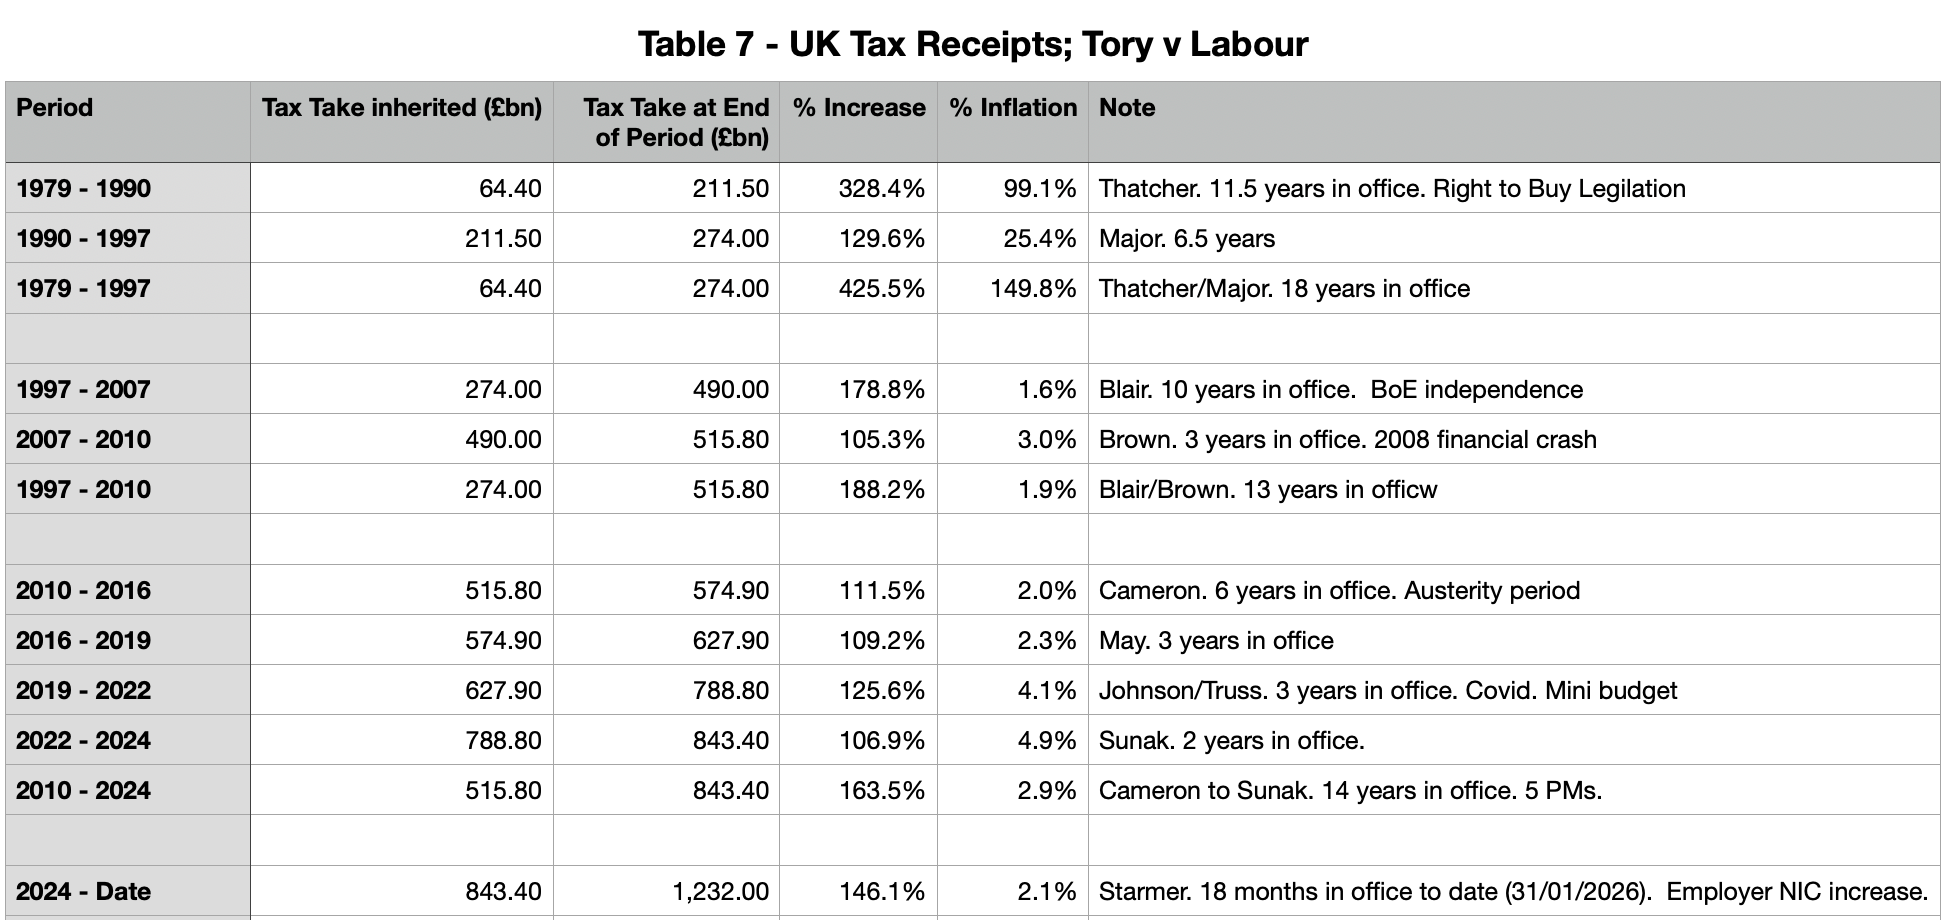
Tax Receipts
Sources9. So the Tories are the “low tax” party are they? Don’t make me laugh. Here are the numbers for you that show that the Tories tax people at higher levels than Labour. What the Tories actually mean is that they are the “low tax for the rich” party - c/f the Liz Truss and Kwasi Kwarteng end of the pier budget show. This illustrates that Labour taxed us less and chose to spend its receipts on improving public services while the Tories tax the majority of ordinary workers more and spend those extra tax receipts on tax cuts for the rich. You need only compare the 13 years of Blair/Brown between 1997 and 2010 with the 14 years of Tory economic incompetence and chaos between 2010 and 2024 to see the truth. Oh and why were tax recipts lower during austerity? Because wages were suppressed of course.
The picture painted above is one of a governing party in a chaos of their own making. From 2010 to 2024, the Tories tried increasingly desperate (and darkly risible) measures to get themselves out of the very deep hole that they were still digging. They failed miserably.
What was the reward for the Tory Chancellors who implemented such demented tax policies? Why, ennoblement - what else?. These former Chancellors now sit or once sat in the House of Lords following their choosing to step down as MPs:
Lord Clarke of Nottingham (Ken Clarke): Chancellor from 1993 to 1997.
Lord Hammond of Runnymede (Philip Hammond): Chancellor from 2016 to 2019.
Lord Lamont of Lerwick (Norman Lamont): Chancellor from 1990 to 1993.
Lord Howe of Aberavon (Geoffrey Howe) and Lord Lawson of Blaby (Nigel Lawson: Both deceased but notable examples.
I expect nearly all of Osborne, Javid, Sunak, Kwarteng and Hunt to follow in the footsteps of the above in the not too distant future. Of course the Tories also have their modern day Lord Percys and Baldricks (for those familiar with Blackadder II). People like Baron Lilley of Offa and Baron Frost of Allenton who despite knowing little about economics, use “tricks and sports and all sorts of jolly, rosy-cheeked capering” to pull the wool over ignorant people’s eyes.
Summary
There you have it ladies and gentlemen of the jury. Proof, if you don’t believe your own lived experience, that far from being the party of economic competence and fiscal responsibility, The Tories are in fact the opposite; incompetent, inept, high taxing, vicious, self-interested and chaotic. If you are one of the top 10% win terms of wealth, you’ll have done very well with the possible exception of Sunak’s administration when the economy was falling apart. If like most of us, are in the remaining 90% of ordinary working people, you’ll have done badly, very badly indeed and if you vote for the Tories (or God forbid, the Reform Ltd company), then I fear for your sanity.
If you think the Tories are bad news for the economy, just wait and watch the Reform Ltd company in action should we ever be stupid enough to elect that bunch of spivs (my opinion) to office and allow the company’s owner and CGO (Chief Grifting Officer), one N.P. Farage, to get his grubby little hands on the levers of power. Be afraid, be very afraid.
Source: Bank of England Inflation Calculator https://www.bankofengland.co.uk/monetary-policy/inflation/inflation-calculator
House of Commons Library https://commonslibrary.parliament.uk/research-briefings/sn06167/
International Monetary Fund https://www.imf.org/external/datamapper/GG_DEBT_GDP@GDD/CAN/FRA/DEU/ITA/JPN/GBR/USA
European Commission https://ec.europa.eu/eurostat/documents/2995521/5061670/2-17082007-AP-EN.PDF/89fdd2c1-6be5-4c0e-a29d-612e6d9f53a4
OBR, Sept 2014 https://ec.europa.eu/eurostat/documents/2995521/5061670/2-17082007-AP-EN.PDF/89fdd2c1-6be5-4c0e-a29d-612e6d9f53a4
Tony Blair, reported in Money Marketing, from an interview with the Financial Times in January 2009 https://www.moneymarketing.co.uk/news/blair-concedes-light-touch-regulation-allowed-credit-crisis-to-develop/
FSA, reported in the Guardian in Dec 2011(https://www.theguardian.com/business/2011/dec/12/labour-regulations-city-rbs-collapse
ConservativeHome, Oct 2012 https://conservativehome.com/2012/10/17/the-public-finances-under-margaret-thatcher-and-under-the-coalition-compared/
Full Fact, Dec 2019 https://fullfact.org/election-2019/ask-fullfact-debt-deficit/
John Major - The Autobiography, October 1999, published at https://johnmajorarchive.org.uk/1997/05/02/review-of-economy-2-may-1997/
Radical Statistics https://www.radstats.org.uk/no107/Reed107.pdf
Bank of England, December 1979 https://www.bankofengland.co.uk/quarterly-bulletin/1979/q4/distribution-of-the-national-debt-at-end-march-1979
LSE, July 2022 https://blogs.lse.ac.uk/politicsandpolicy/thatcher-tory-leadership-candidates/
Bank of England, December 1997 https://www.bankofengland.co.uk/quarterly-bulletin/1997/q4/public-sector-debt-end-march-1997
Full Fact, May 2017 https://fullfact.org/economy/labour-and-conservative-records-national-debt/
ONS, August 2016 https://www.ons.gov.uk/economy/governmentpublicsectorandtaxes/publicsectorfinance/bulletins/publicsectorfinances/july
ONS, November 2022 https://www.ons.gov.uk/economy/governmentpublicsectorandtaxes/publicsectorfinance/bulletins/publicsectorfinances/october2022
Land Registry https://www.gov.uk/search/all?keywords=housing+prices+press+release
ONS, July 2024 https://www.ons.gov.uk/economy/governmentpublicsectorandtaxes/publicsectorfinance/bulletins/publicsectorfinances/june2024
ONS, February 2026 https://www.ons.gov.uk/economy/governmentpublicsectorandtaxes/publicsectorfinance/bulletins/publicsectorfinances/january2026
Chris Hallam, Nov 2020, James Callaghan – An Underrated Prime Minister? https://chrishallamworldview.wordpress.com/tag/unemployment-level-1979/
ONS, published by Full Fact, June 2023 https://fullfact.org/economy/labour-unemployment-record/
House of Lords Library, May 2024 https://lordslibrary.parliament.uk/the-uk-economy-in-the-1980s/
ONS, reported by the BBC, April 2013 https://www.bbc.co.uk/news/uk-politics-22070491
The Spectator, April 2013 https://spectator.com/article/margaret-thatcher-in-six-graphs/
Byline Times, June 2022 https://bylinetimes.com/2022/06/20/every-labour-government-in-history-has-left-unemployment-higher-a-fact-check/
The Guardian, April 2007 https://www.theguardian.com/politics/2007/apr/08/tonyblair.labour7
ONS, published by Full Fact, April 2017 https://fullfact.org/economy/unemployment-under-Labour/
ONS, March 2026 https://www.ons.gov.uk/employmentandlabourmarket/peoplenotinwork/unemployment/timeseries/mgsx/lms
ONS, February 2019, search https://www.google.com/url?sa=t&source=web&rct=j&url=https://www.ons.gov.uk/employmentandlabourmarket/peopleinwork/employmentandemployeetypes/articles/ukandnonukpeopleinthelabourmarket/february2019/pdf
ONS, published by Full Fact, March 2026 https://fullfact.org/economy/employment-jobs-explainer/
TUC, June 2024 https://www.tuc.org.uk/blogs/labour-market-figures-conservatives-have-failed-working-people
Bank of England Inflation calculator https://www.bankofengland.co.uk/monetary-policy/inflation/inflation-calculator
ONS, March 2017 https://www.ons.gov.uk/aboutus/transparencyandgovernance/freedomofinformationfoi/averagesalarybetween1980and1997
ONS, published in the Guardian, December 2010 https://www.theguardian.com/money/2010/dec/08/annual-earnings-standstill-ons-pay-survey
Statista https://www.statista.com/statistics/1002964/average-full-time-annual-earnings-in-the-uk/
ONS, October 2019 https://www.ons.gov.uk/employmentandlabourmarket/peopleinwork/earningsandworkinghours/bulletins/annualsurveyofhoursandearnings/2019
Common Wealth, August 2025, https://www.common-wealth.org/publications/restoring-council-housing-after-right-to-buy
Valuation Office, https://www.gov.uk/government/collections/private-rental-market-statistics
Valuation Office, https://www.gov.uk/search/all?keywords=social+rental+market+statistics
ONS, https://www.ons.gov.uk/search?q=housing+summary+measures+analysis
ONS, November 2022, https://www.ons.gov.uk/economy/inflationandpriceindices/bulletins/indexofprivatehousingrentalprices/october2022
ONS, July 2024 https://www.ons.gov.uk/economy/inflationandpriceindices/bulletins/privaterentandhousepricesuk/july2024
House of Commons, June 2017 https://commonslibrary.parliament.uk/research-briefings/cbp-7706/
House of Commons, https://commonslibrary.parliament.uk/search?s=Home+ownership+and+renting+demographics&searchblogs=1&startdate=&enddate=
Thatcher was a past master in communications. Following the ‘Labour isn’t Working’ ad and the Right to Buy messaging, she was successful again with the “If you see Sid, tell him” ads that the Toris commissioned for the privatisation of British Gas
Despite being a free markets zealot, Thatcher was happy to abandon the property free market in order to achieve her political goals. A more hypocritical and blatant example of political expediency than “Right to Buy” I have yet to find
In 1979 when Thatcher took office, the Land Registry average UK house price required 4.1 times the UK average salary for a full time worker to buy (https://hansard.parliament.uk/commons/1979-04-03/debates/a2bbe635-766b-47c7-9ed5-1ec2ad6ff487/Wages)
When Sunak left office that number was 8.2 (https://www.ons.gov.uk/peoplepopulationandcommunity/housing/bulletins/housingaffordabilityinenglandandwales/2024)
Under Starmer, to end January 2026, the number has reduced to 7.0 (https://www.ons.gov.uk/economy/inflationandpriceindices/bulletins/privaterentandhousepricesuk/january2026)
 | A guest post by
|
Hi Patricia. Yes a post about the social and public services record of the two parties would be very revealing. I'll consider writing one. In the meantime I have described my recent NHS experiences. do read them if you'd care to ..
https://andygjburge.substack.com/p/my-nhs-experience
https://andygjburge.substack.com/p/my-nhs-experience-continues
I was 19 when Thatcher came to power.
Since then Tory policies inc. the financialisation of the economy have made a complete and utter mess of things.
Seen it all and the whole lot is traceable back to her policies, attitudes and values.
Their claim to be uniquely competent is an outright lie.